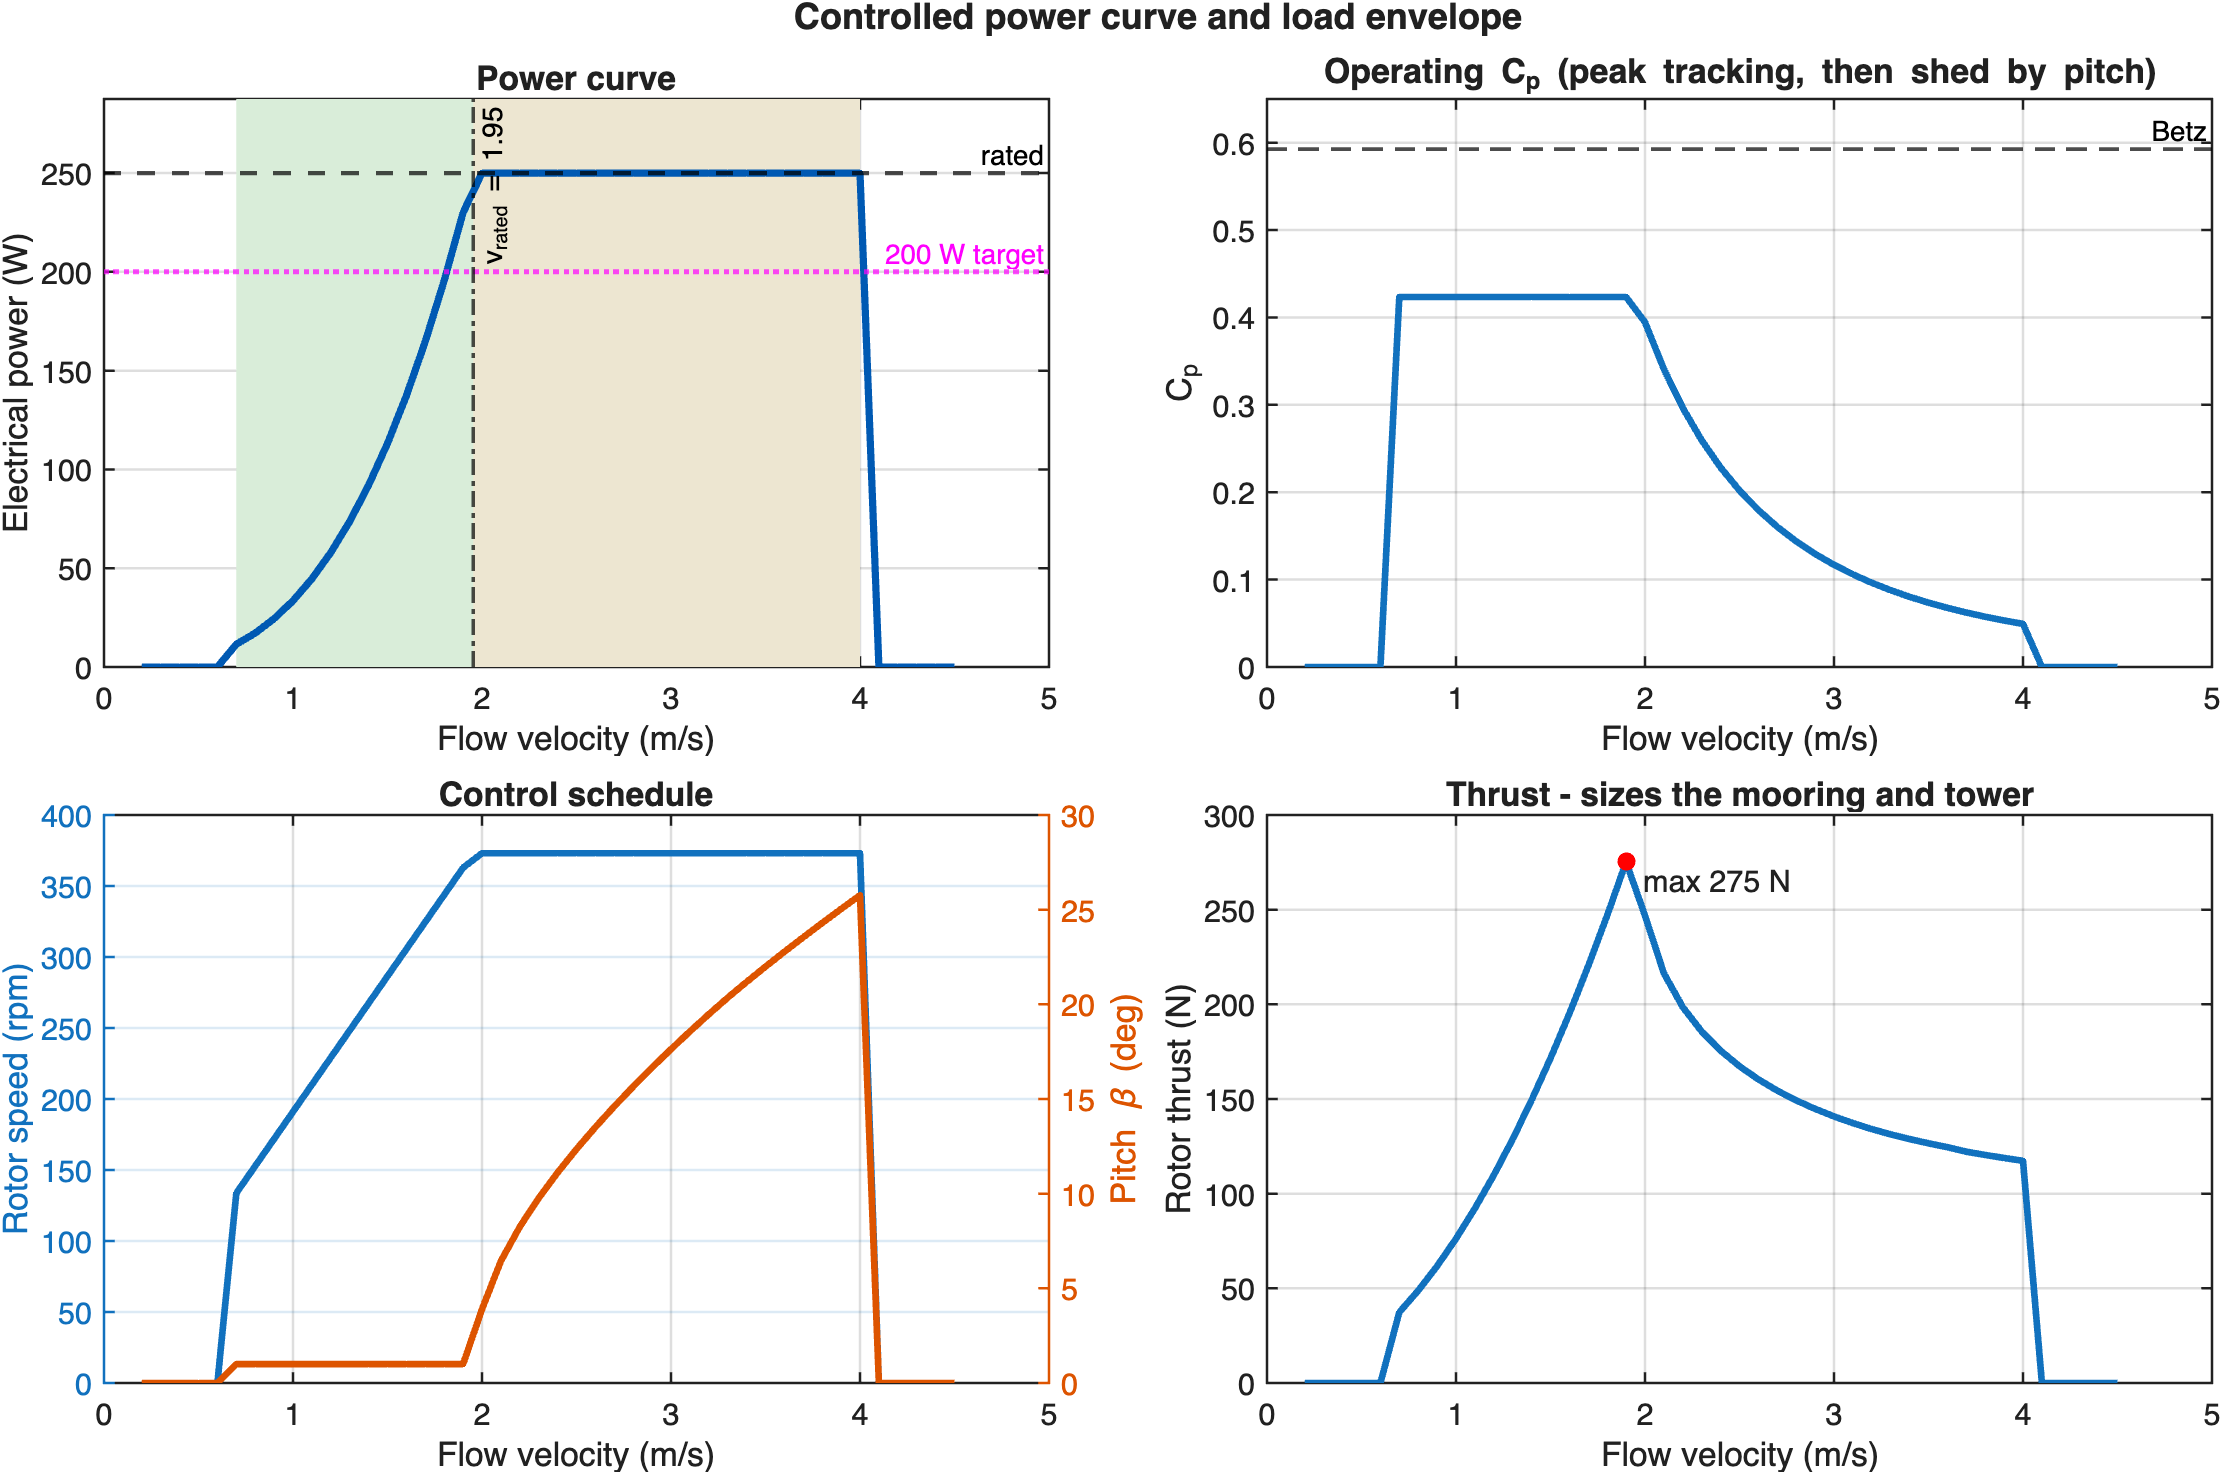
A portable turbine, sized and proven before it's built
A river turbine meant to be carried to a site: 0.5 m across, targeting 200 W of continuous output in a 2 m/s current. Rather than build first and test later, the goal was to size the rotor, predict its performance, and quantify the risk of missing the target — entirely in MATLAB, before committing to hardware.
The first version broke a physical limit it didn't know existed
My first pass at this project modeled turbine power as an assumed efficiency curve — 0.85 times the sine of blade angle, multiplied straight through the kinetic power in the flow. It looked reasonable plotted out, and it was wrong in every way that mattered.
It wasn't physics: a sine curve climbs monotonically, so the "optimum blade angle" it reported was just the edge of whatever axis range I'd plotted — the model was structurally incapable of finding a real peak. It broke the Betz limit: a free-stream rotor can't capture more than 16/27 ≈ 59.3% of the kinetic energy passing through its swept area, a hard result from momentum conservation, and the old model let the power coefficient reach 0.85. Tip-speed ratio — the parameter that actually governs how an axial turbine behaves — never appeared in it at all. And the scale was off by roughly 200×: at the rotor size and flow speed I was describing everywhere else as a 200 W machine, the old script printed about 41 kW.
Blade element momentum theory, solved iteratively over 40 rings
The rotor is split into 40 annular rings. For each ring, momentum theory (what the flow gives up) and blade element theory (what the airfoil section actually produces, from its lift and drag) are set equal, and the axial and tangential induction factors are iterated until both descriptions agree. That reconciliation is the entire method — loads and induced velocities have to be self-consistent at every ring.
A plain BEM solver fails in three known ways, and the fixes are standard results from the wind energy literature rather than anything I derived: a tip and hub loss factor for the finite number of blades, an empirical thrust correction for where momentum theory predicts flow reversal, and a flat-plate extension for the 30–70° angles of attack the blade sections see at startup, far outside normal airfoil data.
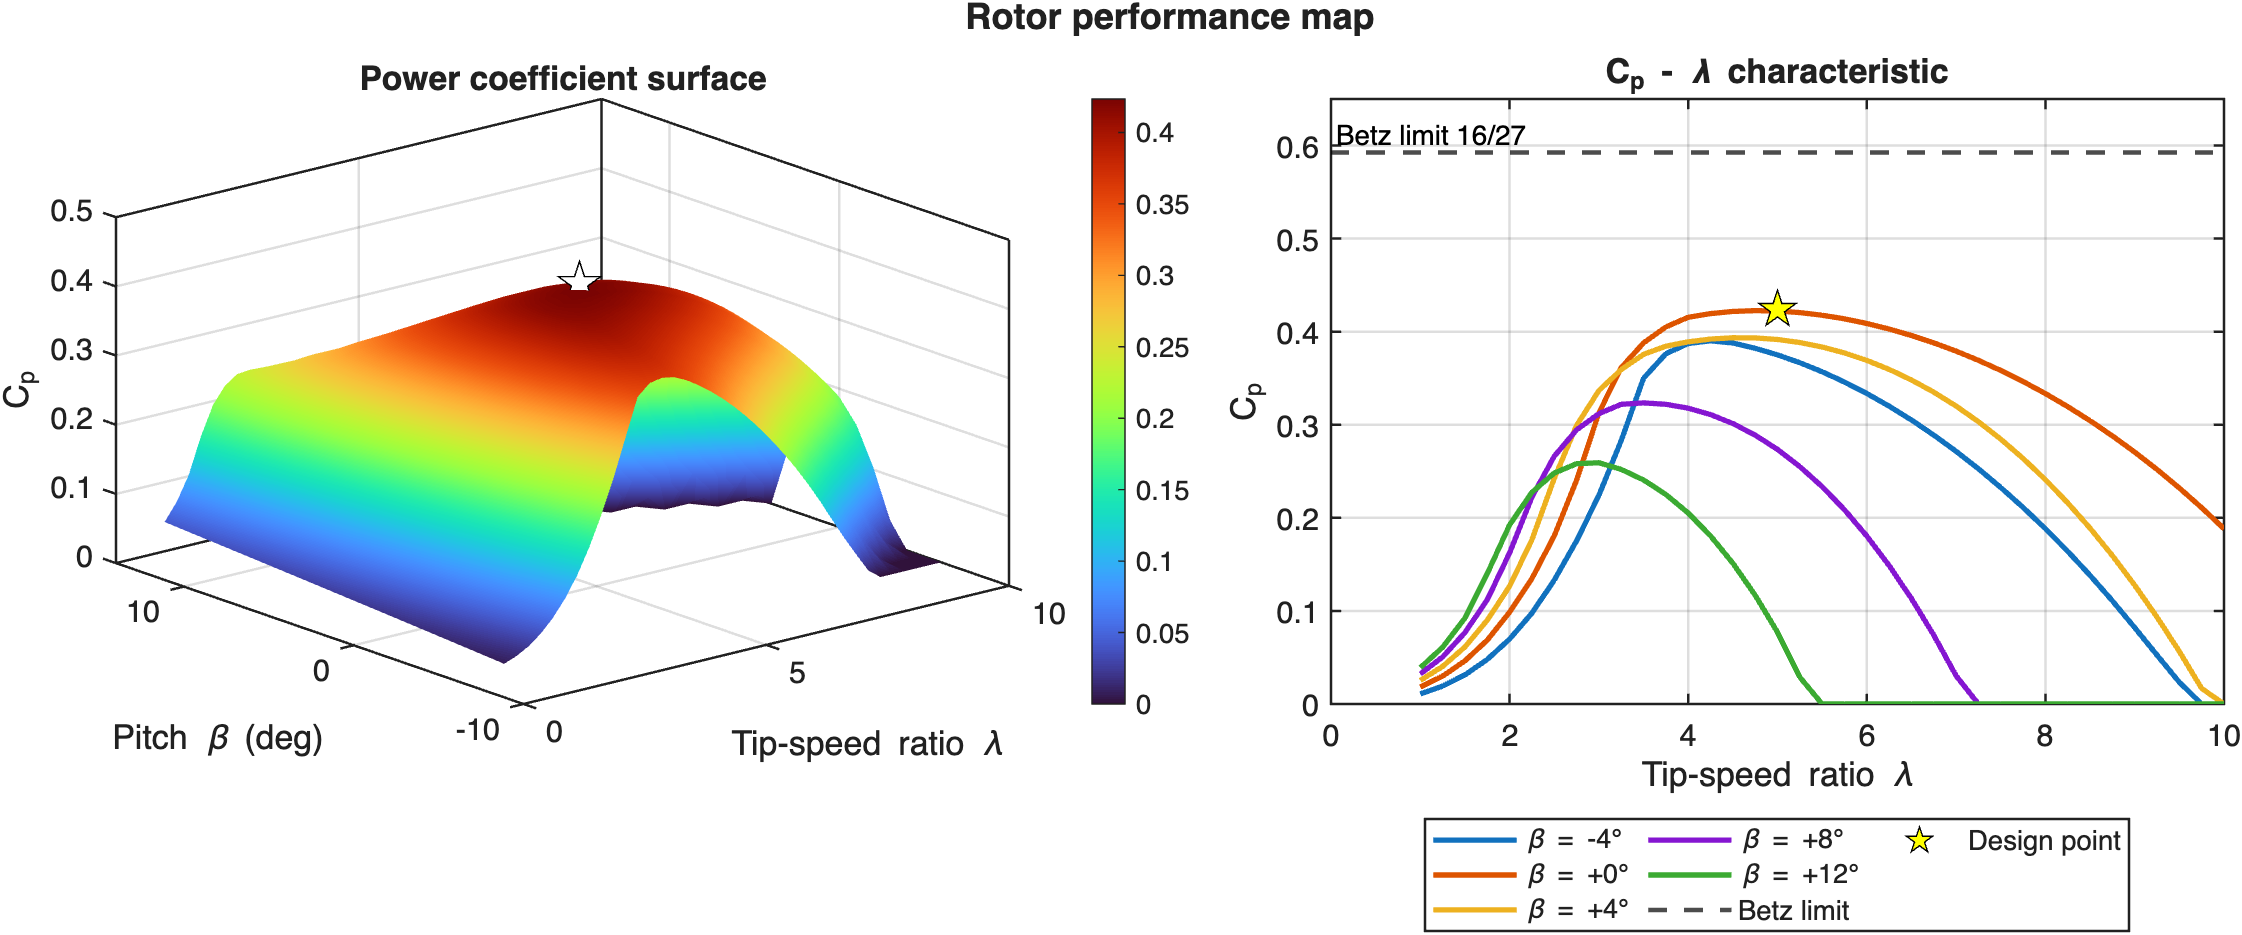
Cp vs. tip-speed ratio and pitch, plotted against the Betz limit — the map a controller is actually designed against, since Cp doesn't change with flow speed.
Four checks run before any number gets reported
The check I trust most: with drag deleted, blade count pushed high enough that tip loss disappears, and the rotor spun fast, the solver has no literature corrections left to hide behind — it has to reproduce the textbook actuator disc result. It returns Cp = 0.5701, 3.8% off the 16/27 limit, with the induction factor landing at 0.360 against the theoretical 1/3. Grid convergence, checked by Richardson extrapolation across 10 to 160 blade elements, gives an order of p = 1.52 and 0.09% discretization error at the 40 elements actually used, and the momentum closure residual at every ring stays below 2×10⁻⁶.
200 W target cleared, with the risk quantified
At the design point — 2.0 m/s, tip-speed ratio 5.0, pitch +1.0° — the rotor produces 332 W shaft power and 268 W electrical, well past the 200 W target. Run through a year of representative river flow, that's 1202 kWh/yr at a 54.9% capacity factor. Six hundred Monte Carlo trials, sweeping manufacturing tolerance and river variability together, put the probability of clearing 200 W at 93.5%.
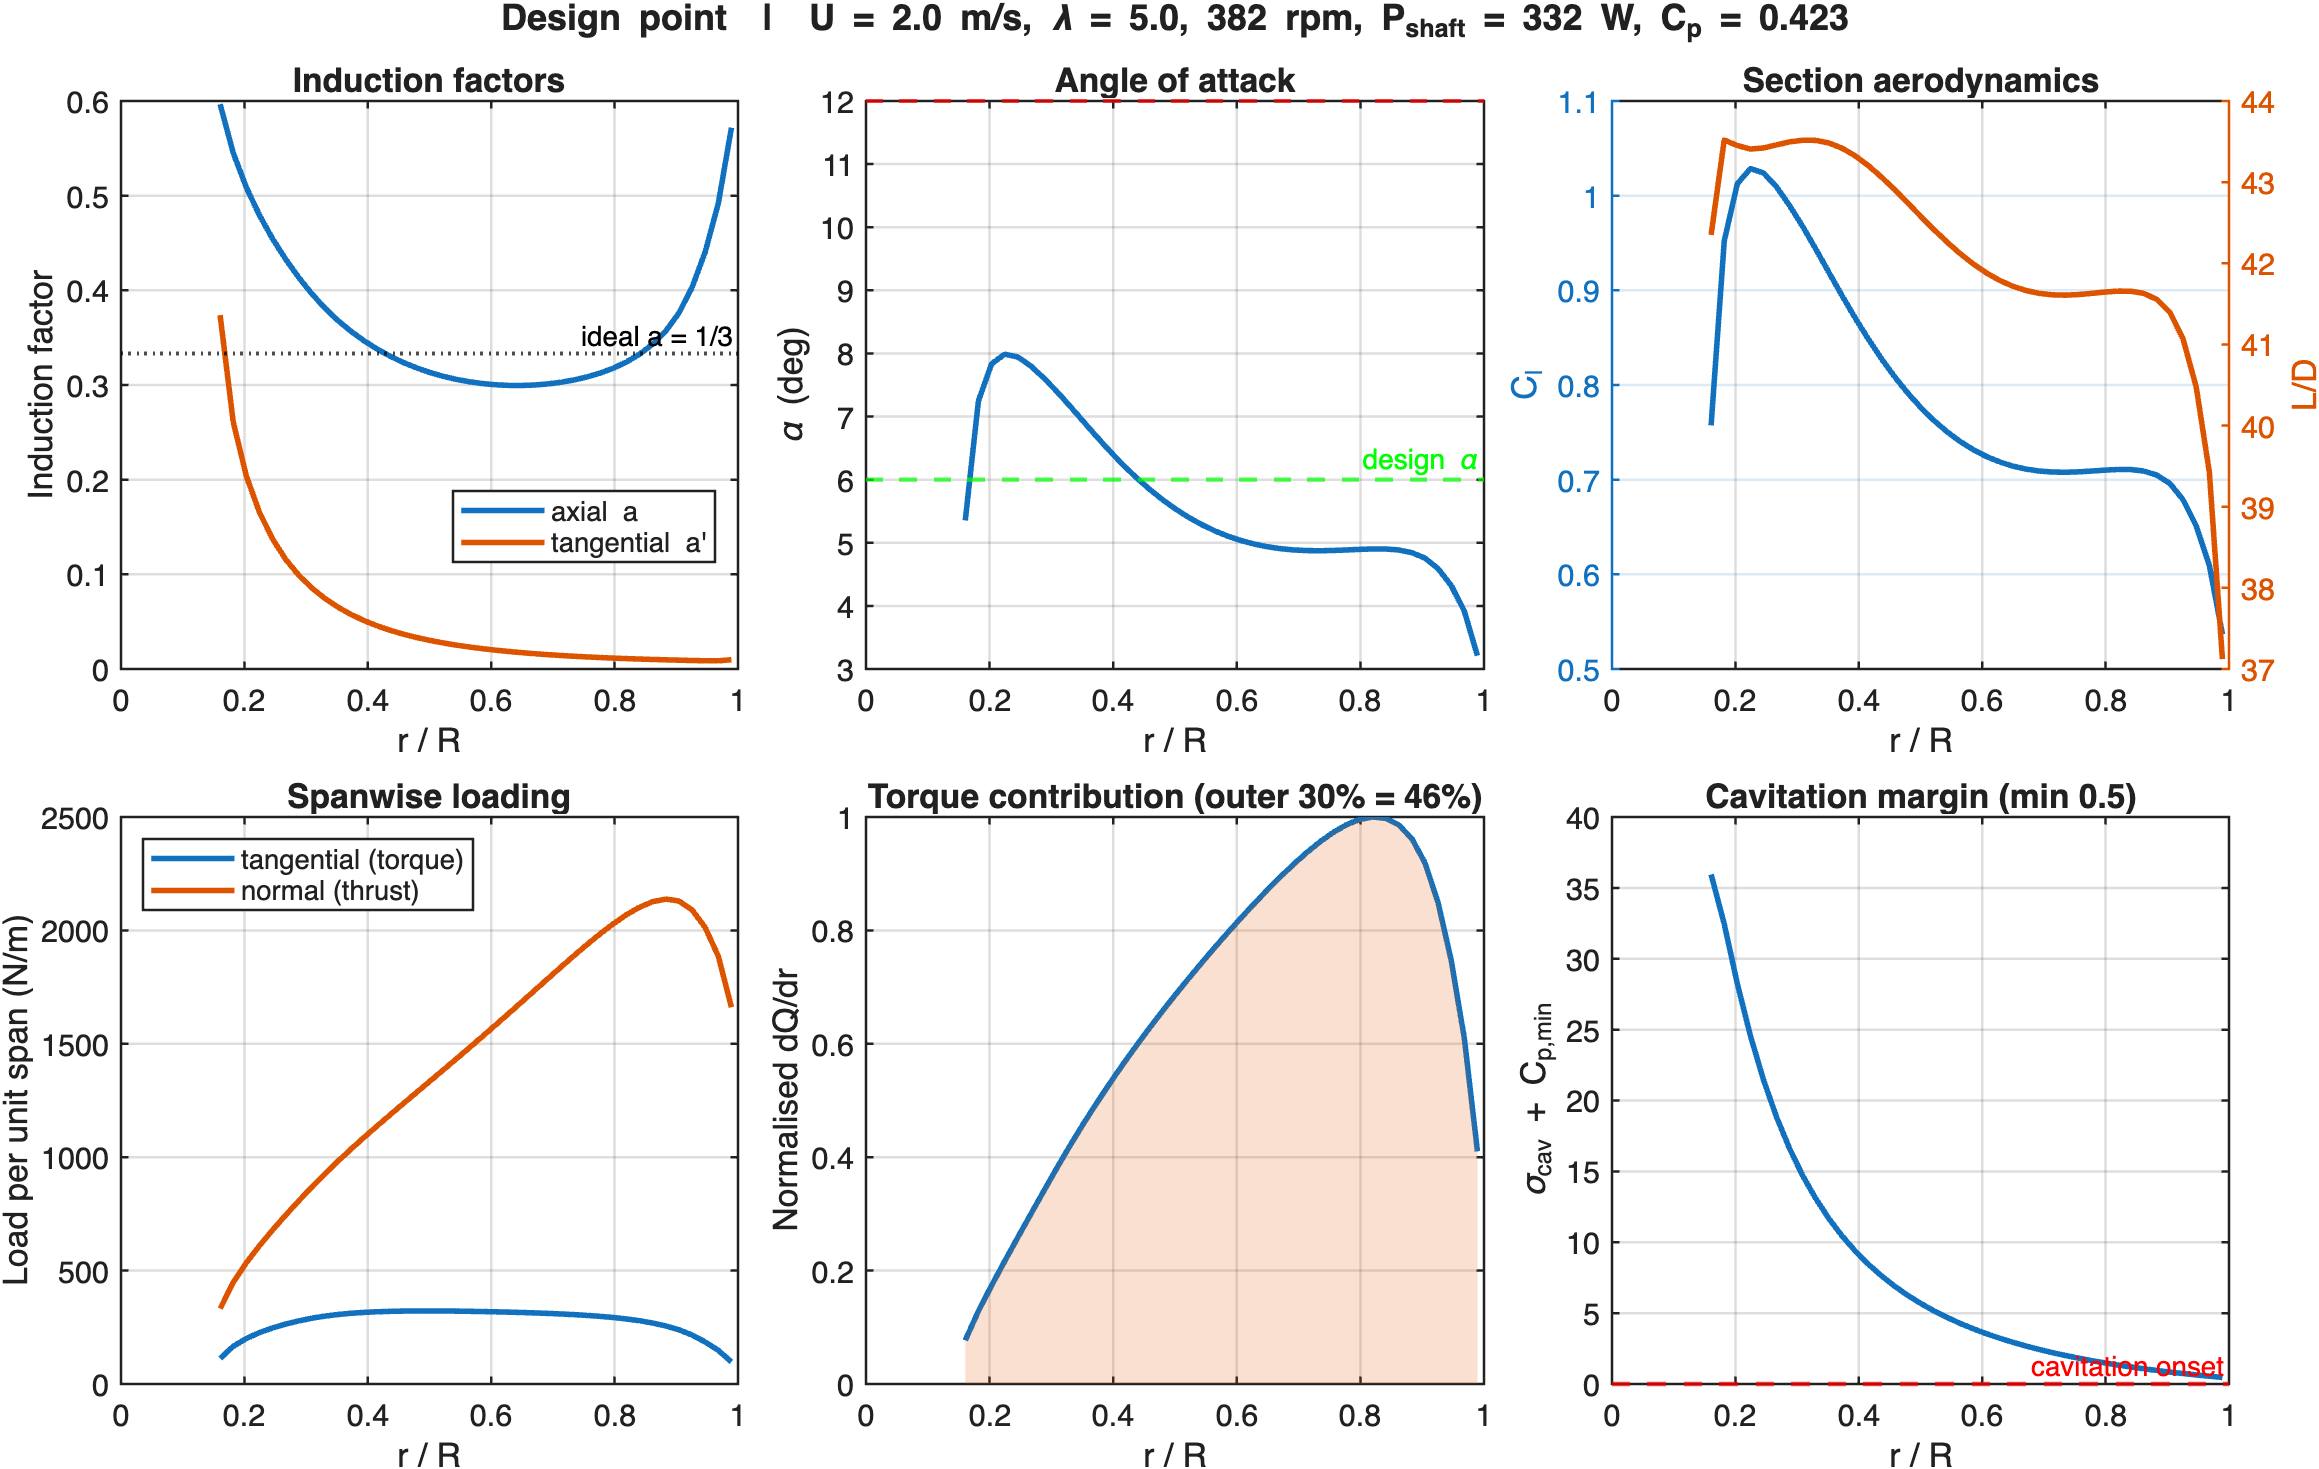
Loading along the blade at the design point. The outer 30% of the span produces 46% of the torque — where the structural work and surface finish are worth the effort.
One result I wouldn't have guessed without plotting it: peak thrust of 275 N hits at the rated condition, not at cut-out, because above rated the blades pitch toward feather to hold power constant, which sheds thrust as the flow keeps speeding up. So the mooring gets sized by the 1.95 m/s case, not the 4 m/s case. Mass comes out to 10.3 kg against the 12 kg budget.
The site matters more than the hardware
In the Monte Carlo, flow velocity correlates with output power at +0.83 — more than every manufacturing variable put together. A 12% error in the river survey costs more power than a 4% error in blade chord. That surprised me, and if I were resourcing this project again I'd spend more of the budget characterizing the site and less refining the blade geometry.
The model has real limits worth stating plainly. The lift and drag data is analytical — a linear curve plus a flat-plate extension — not wind-tunnel or XFOIL data at the Reynolds number this actually runs at, so absolute Cp should be trusted to roughly ±10%; trends and optimum points are more reliable than the single number. Flow is assumed steady, uniform, and straight-on, with no yaw, shear, or channel blockage. And the 10.3 kg mass is a scaling estimate, not a bill of materials from CAD.